DG CAA - 4 Airports in Bulgaria
Passenger feedback via QR codes at every zone - from check-in to baggage belt. 7 languages, automatic notifications, and a real-time management dashboard.
Real-time passenger feedback
The Challenge
Bulgaria's four airports - Sofia, Varna, Burgas, and Plovdiv - relied on sporadic paper surveys. Data arrived weeks after travel, was processed manually, and did not allow comparison between zones.
The Solution
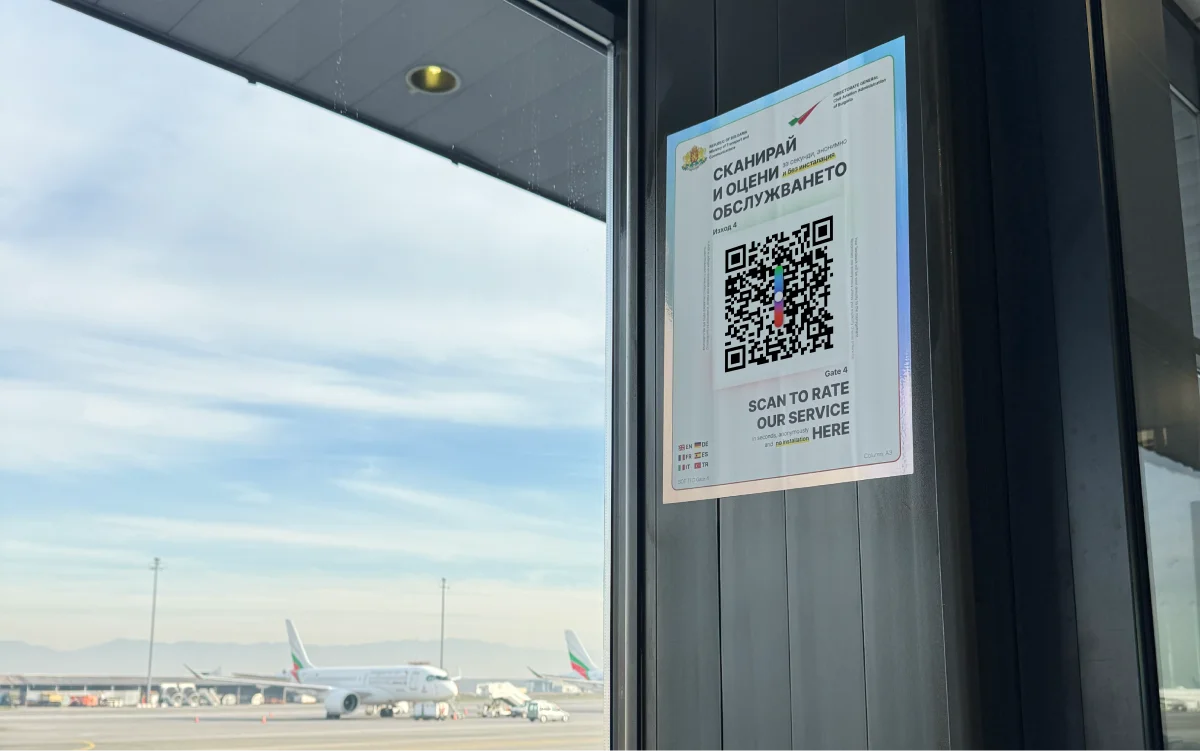
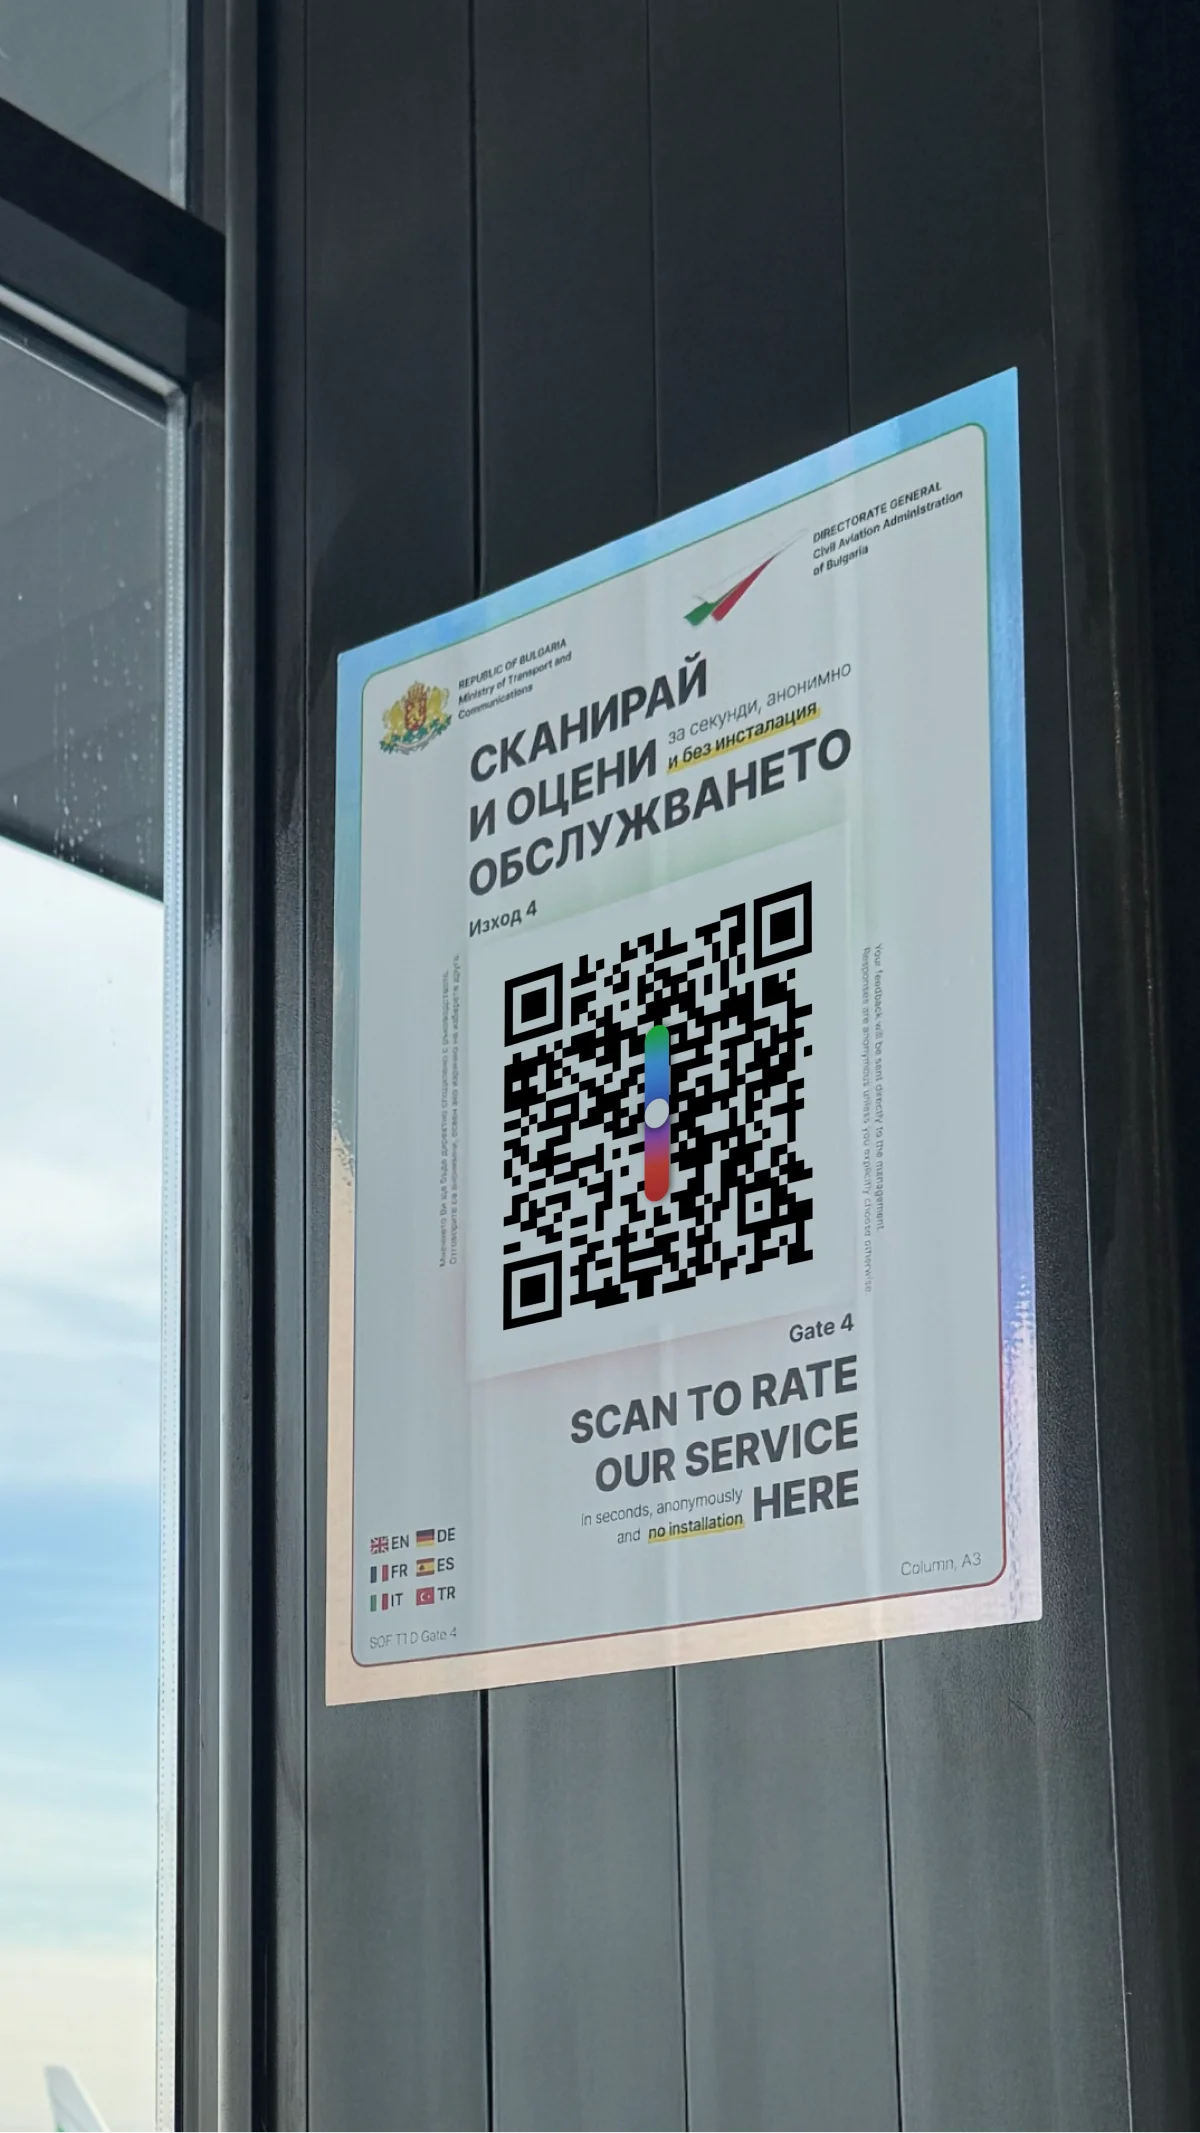
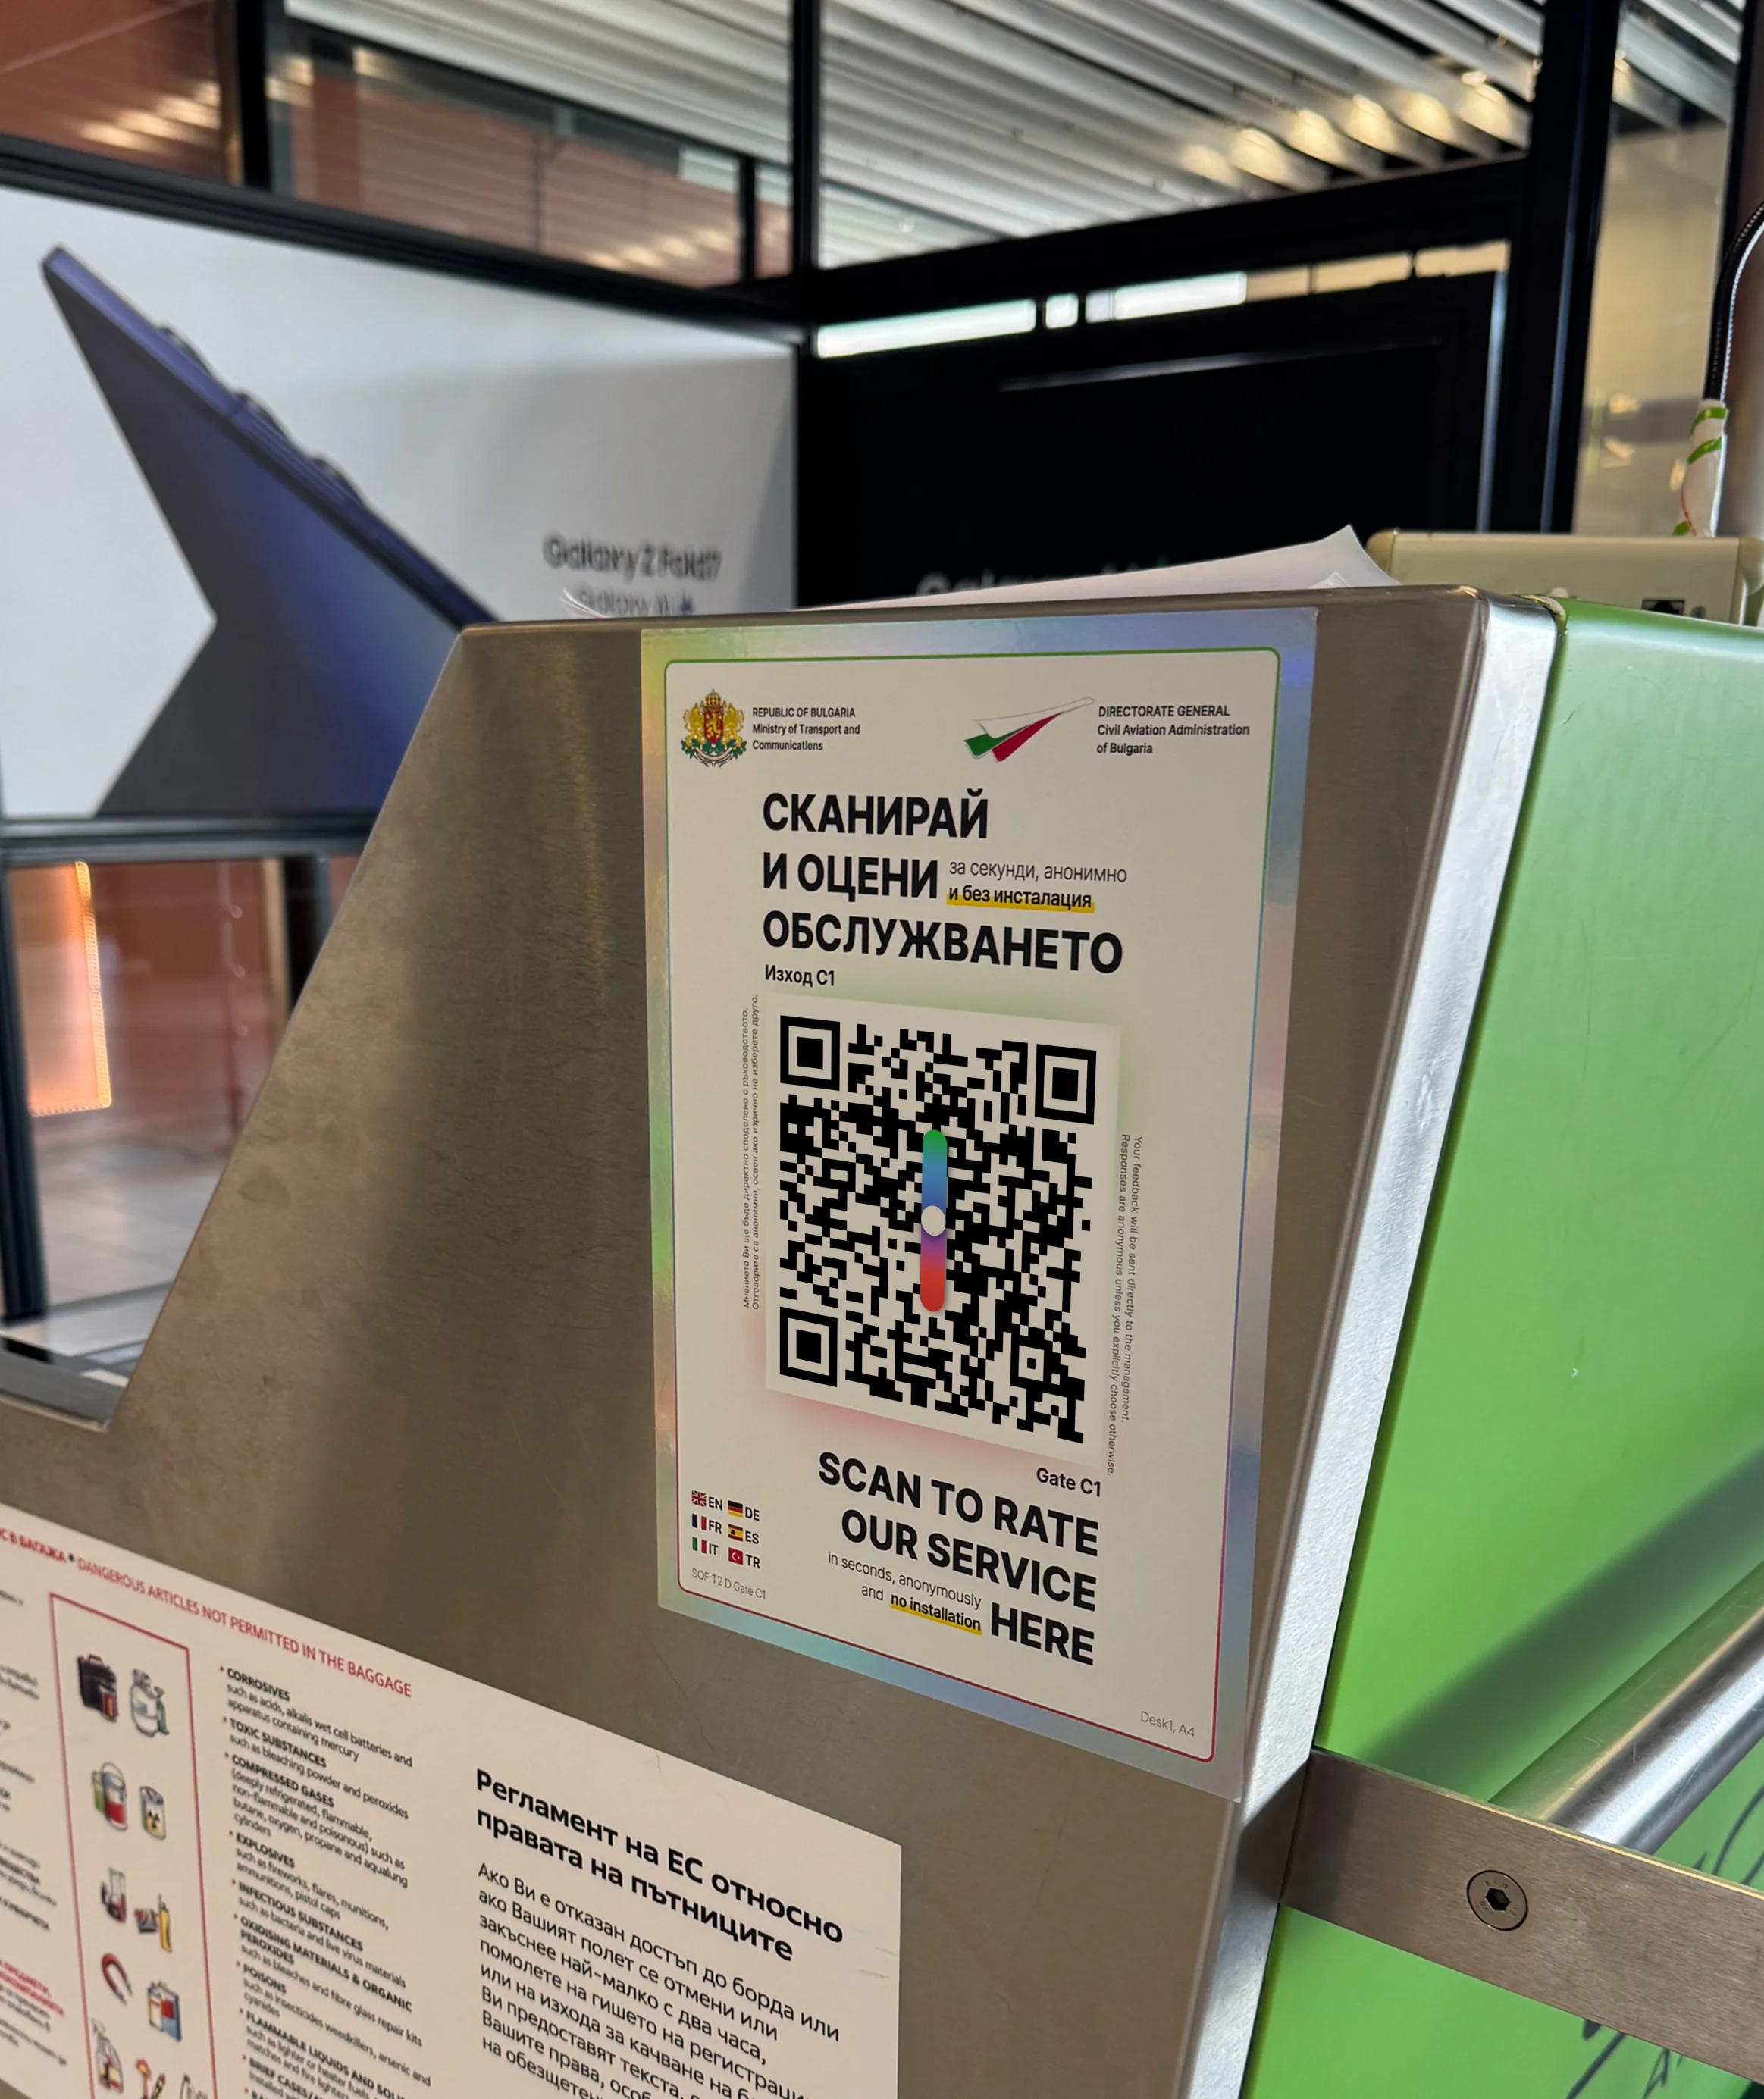
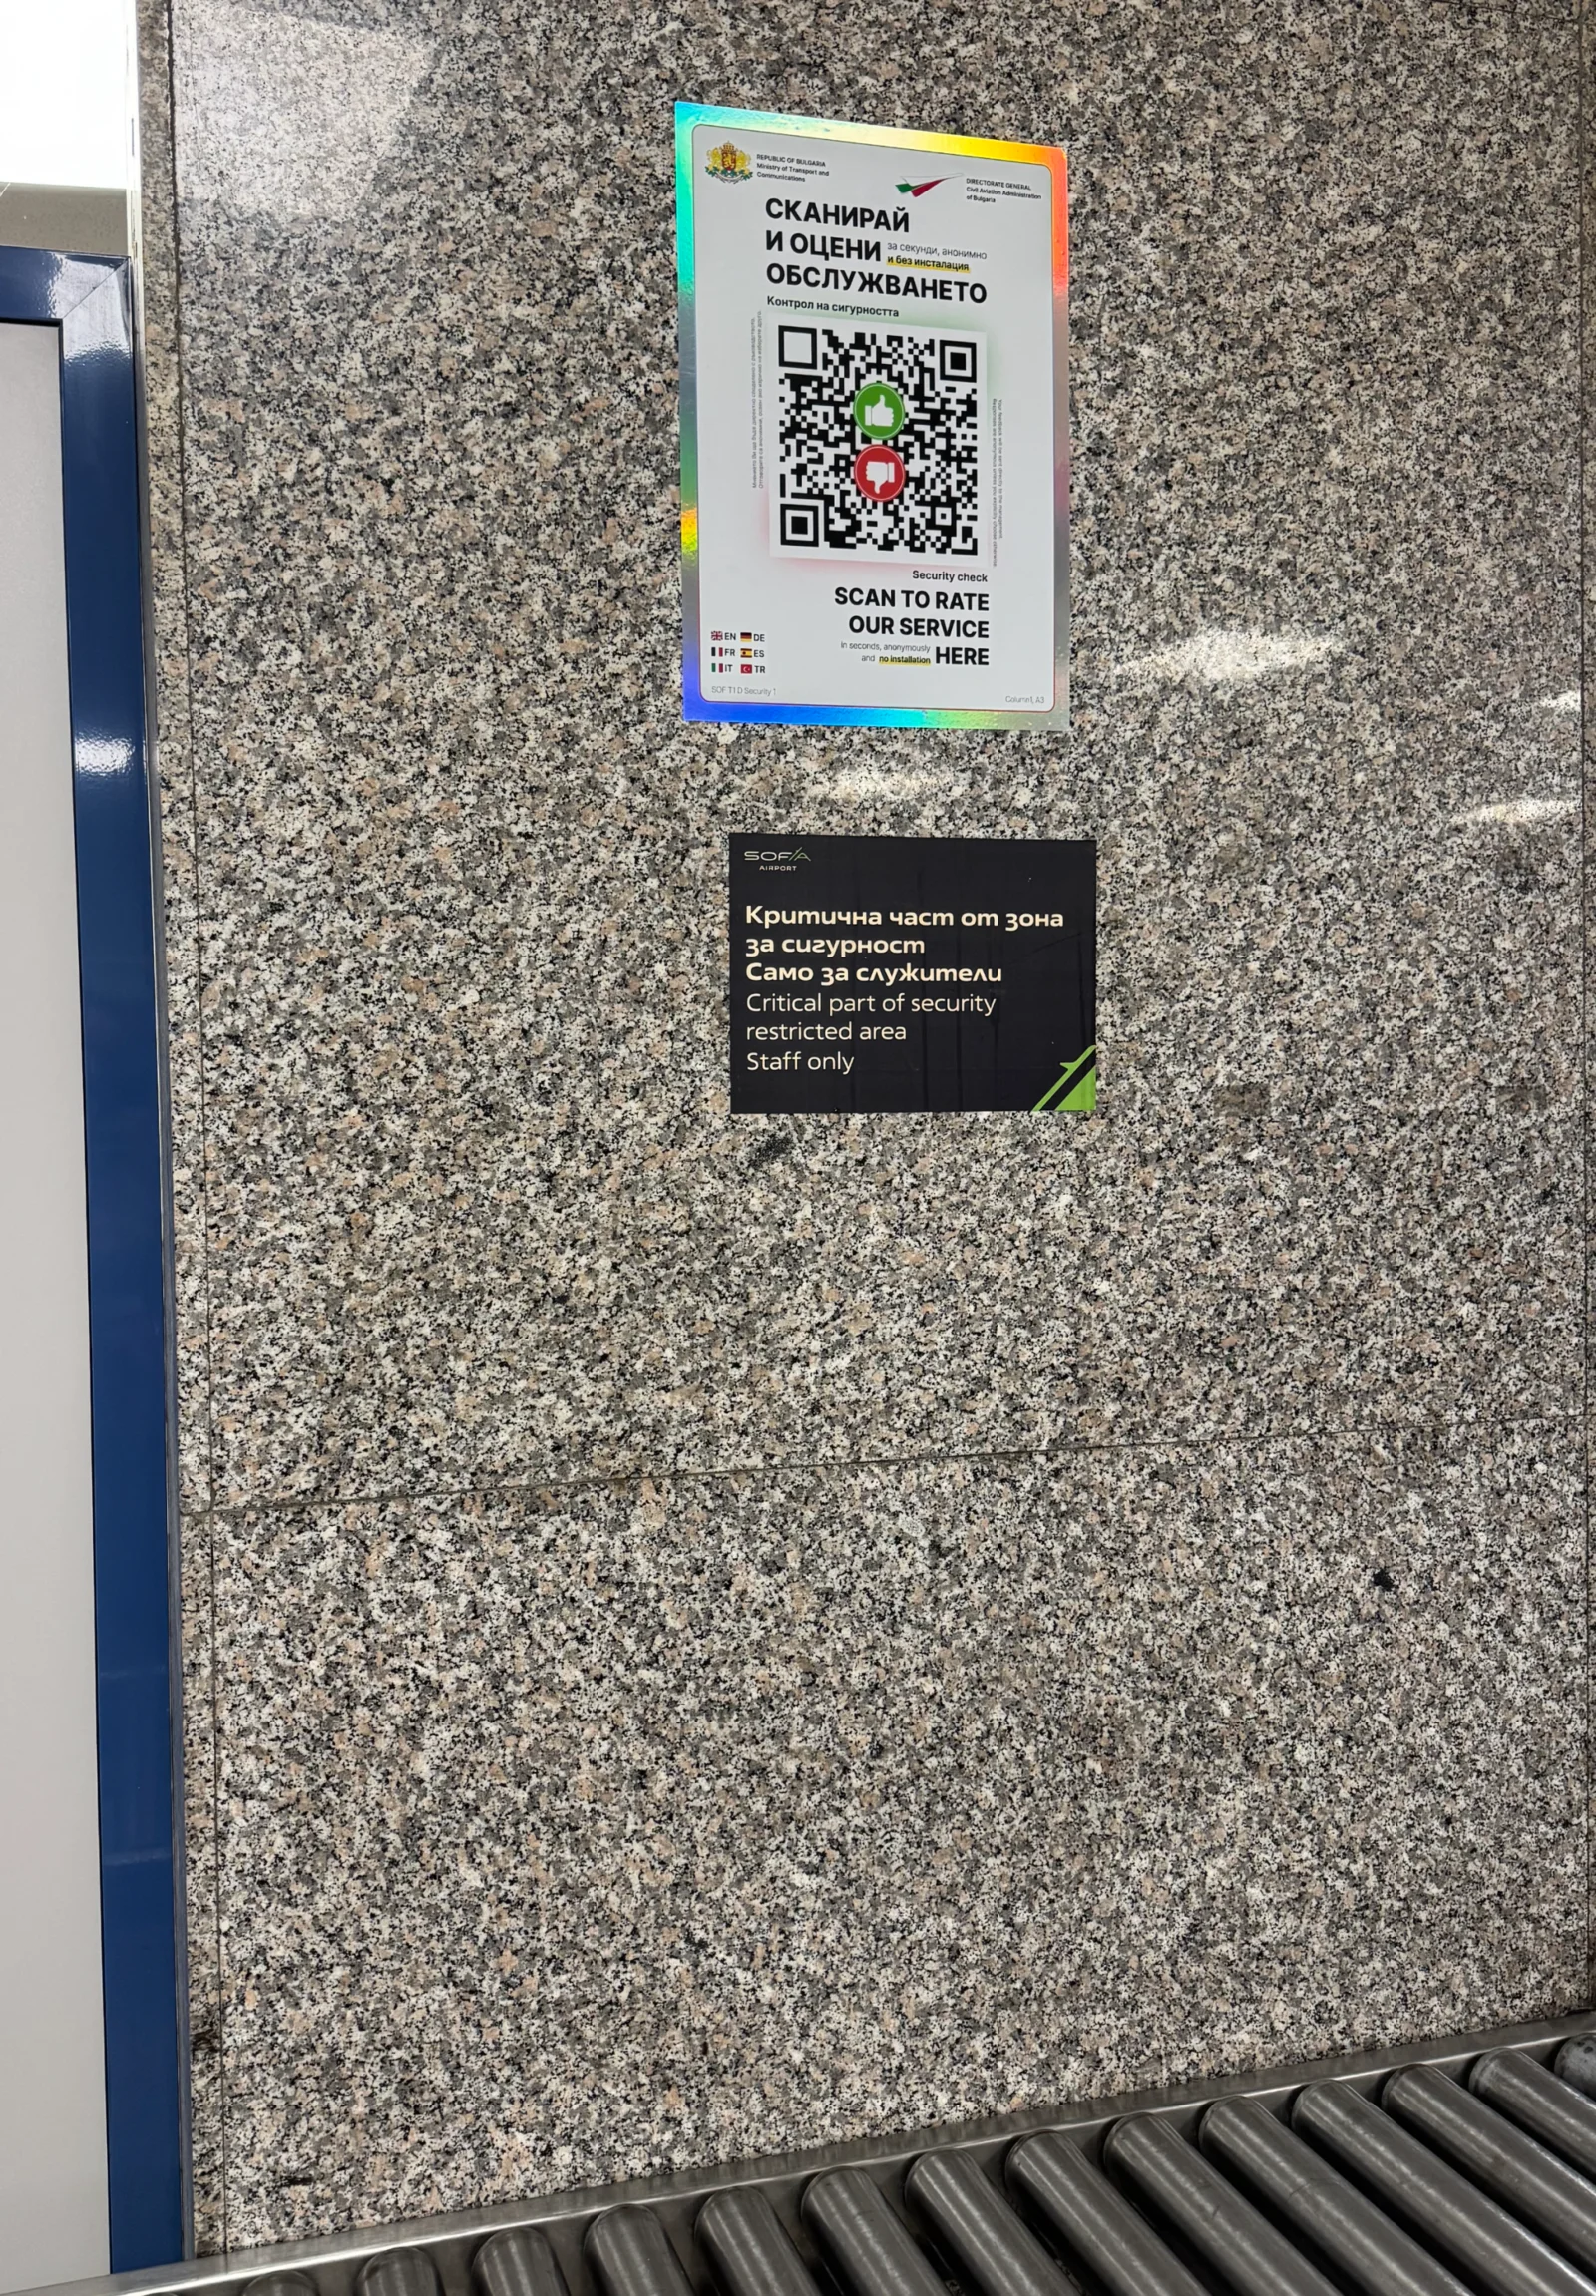
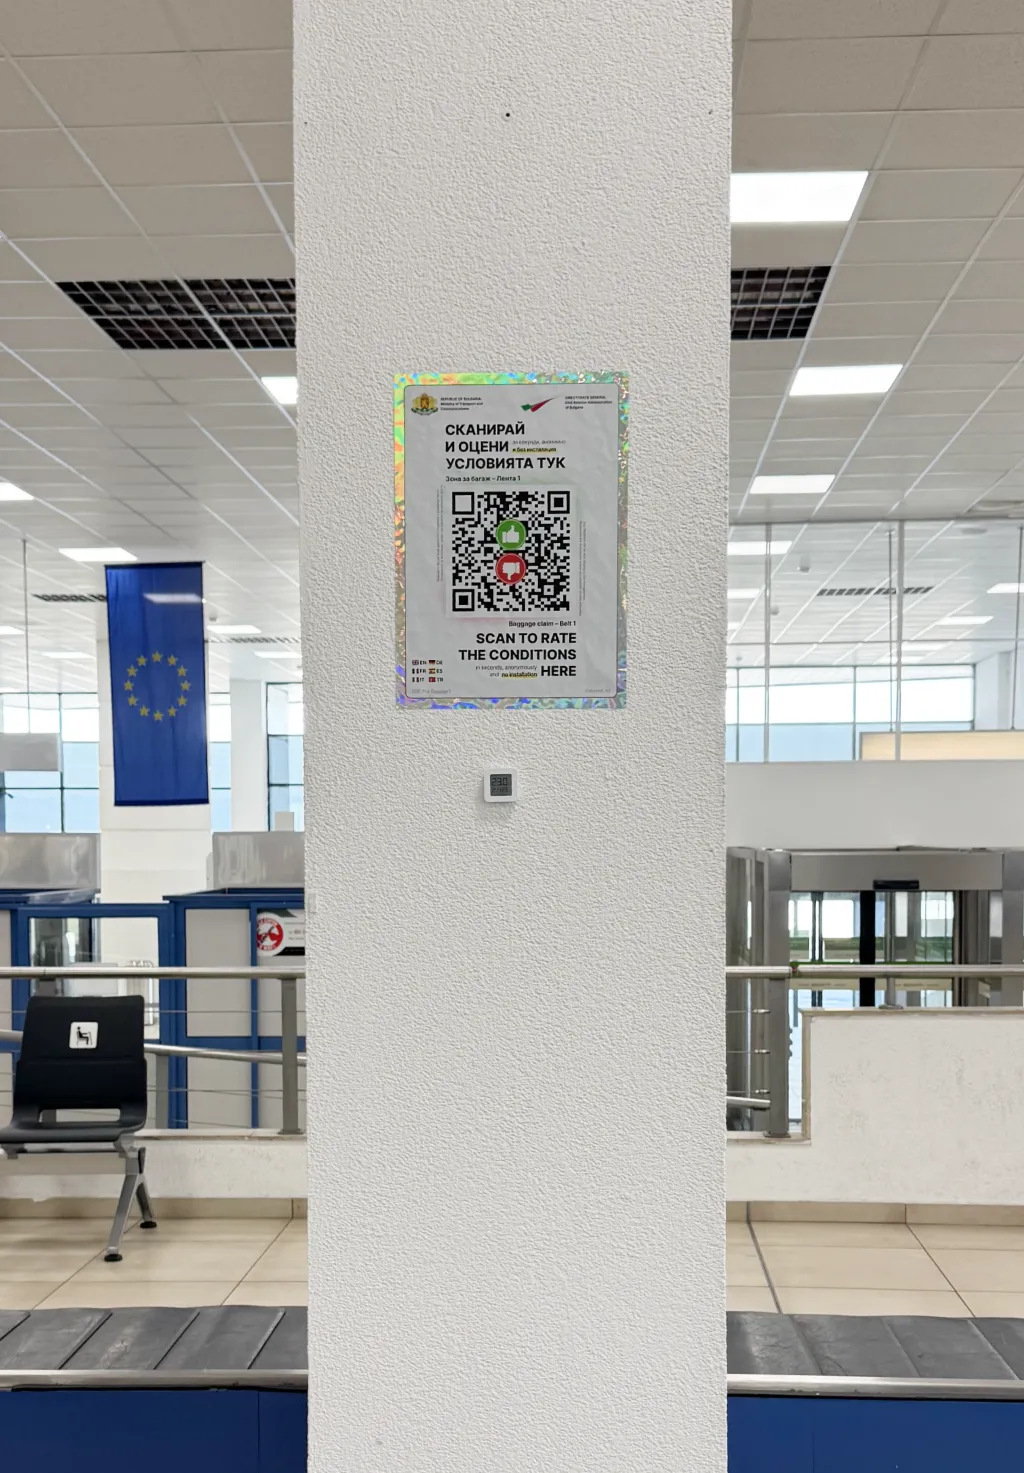
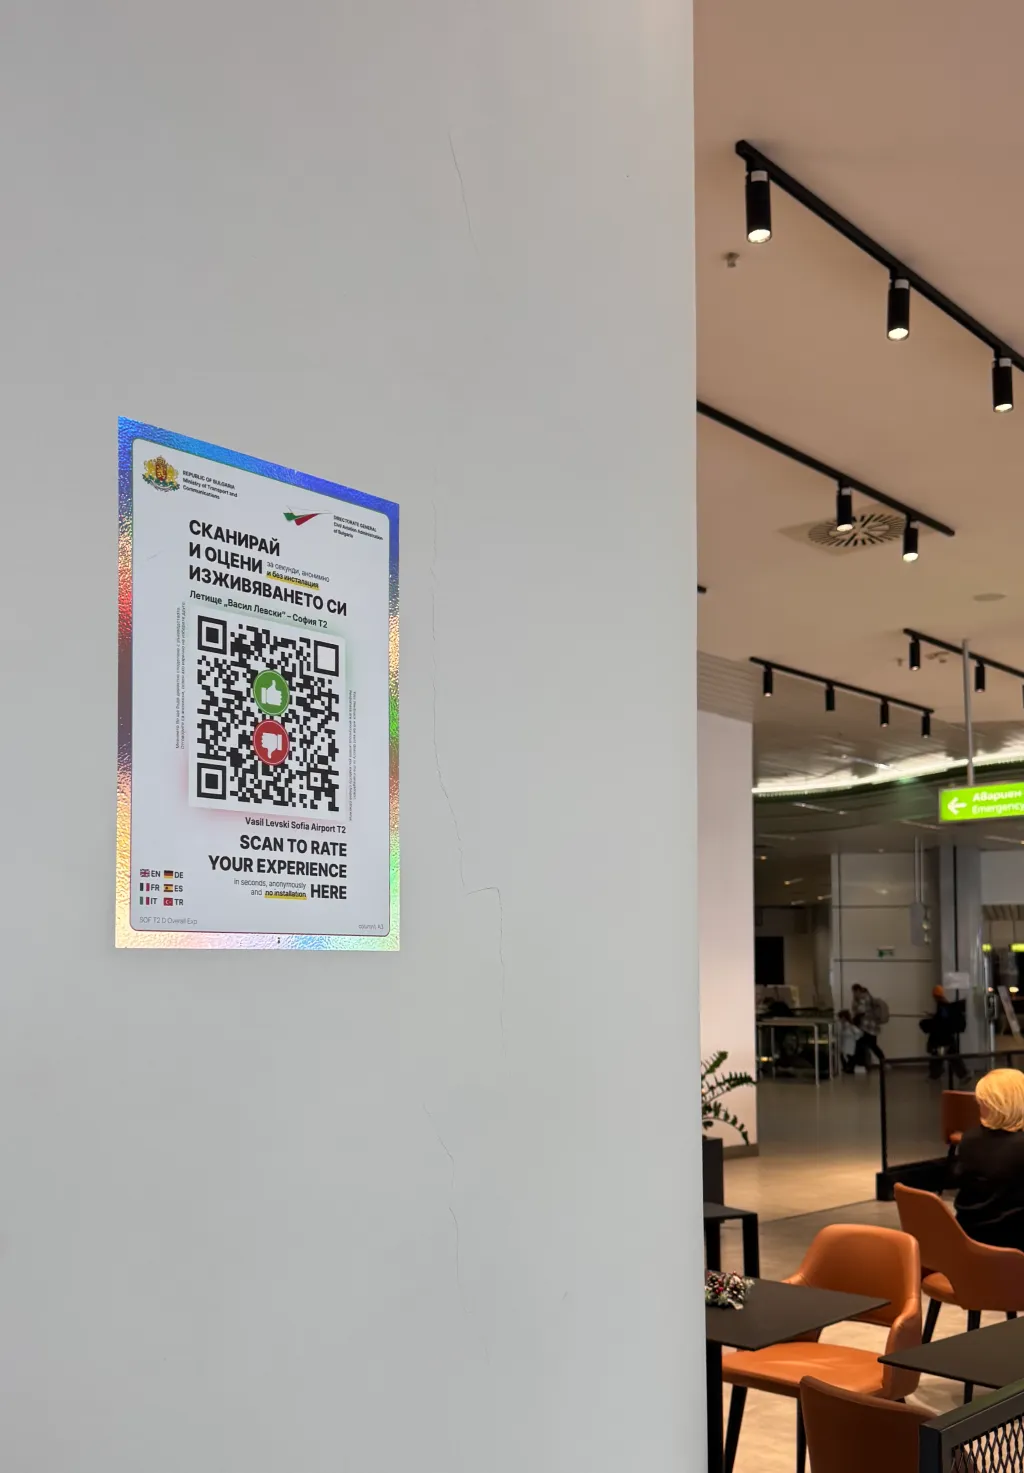
kazva.bg provided QR codes at 500+ points across the four airports - from check-in to baggage belts. Questions are available in 7 languages and adapt automatically. Rating takes under 60 seconds.
When a low rating is given, the manager receives an automatic notification with location and details. Each airport has a management dashboard in real time with NPS by zone, trends, and comparative analysis.
Results
Thousands of passenger opinions every month from four airports. For the first time, there is objective data for comparison between airports and zones.
How it works
From terminal to dashboard in 60 seconds
Scans
The QR code at check-in, security, gate, or baggage hall
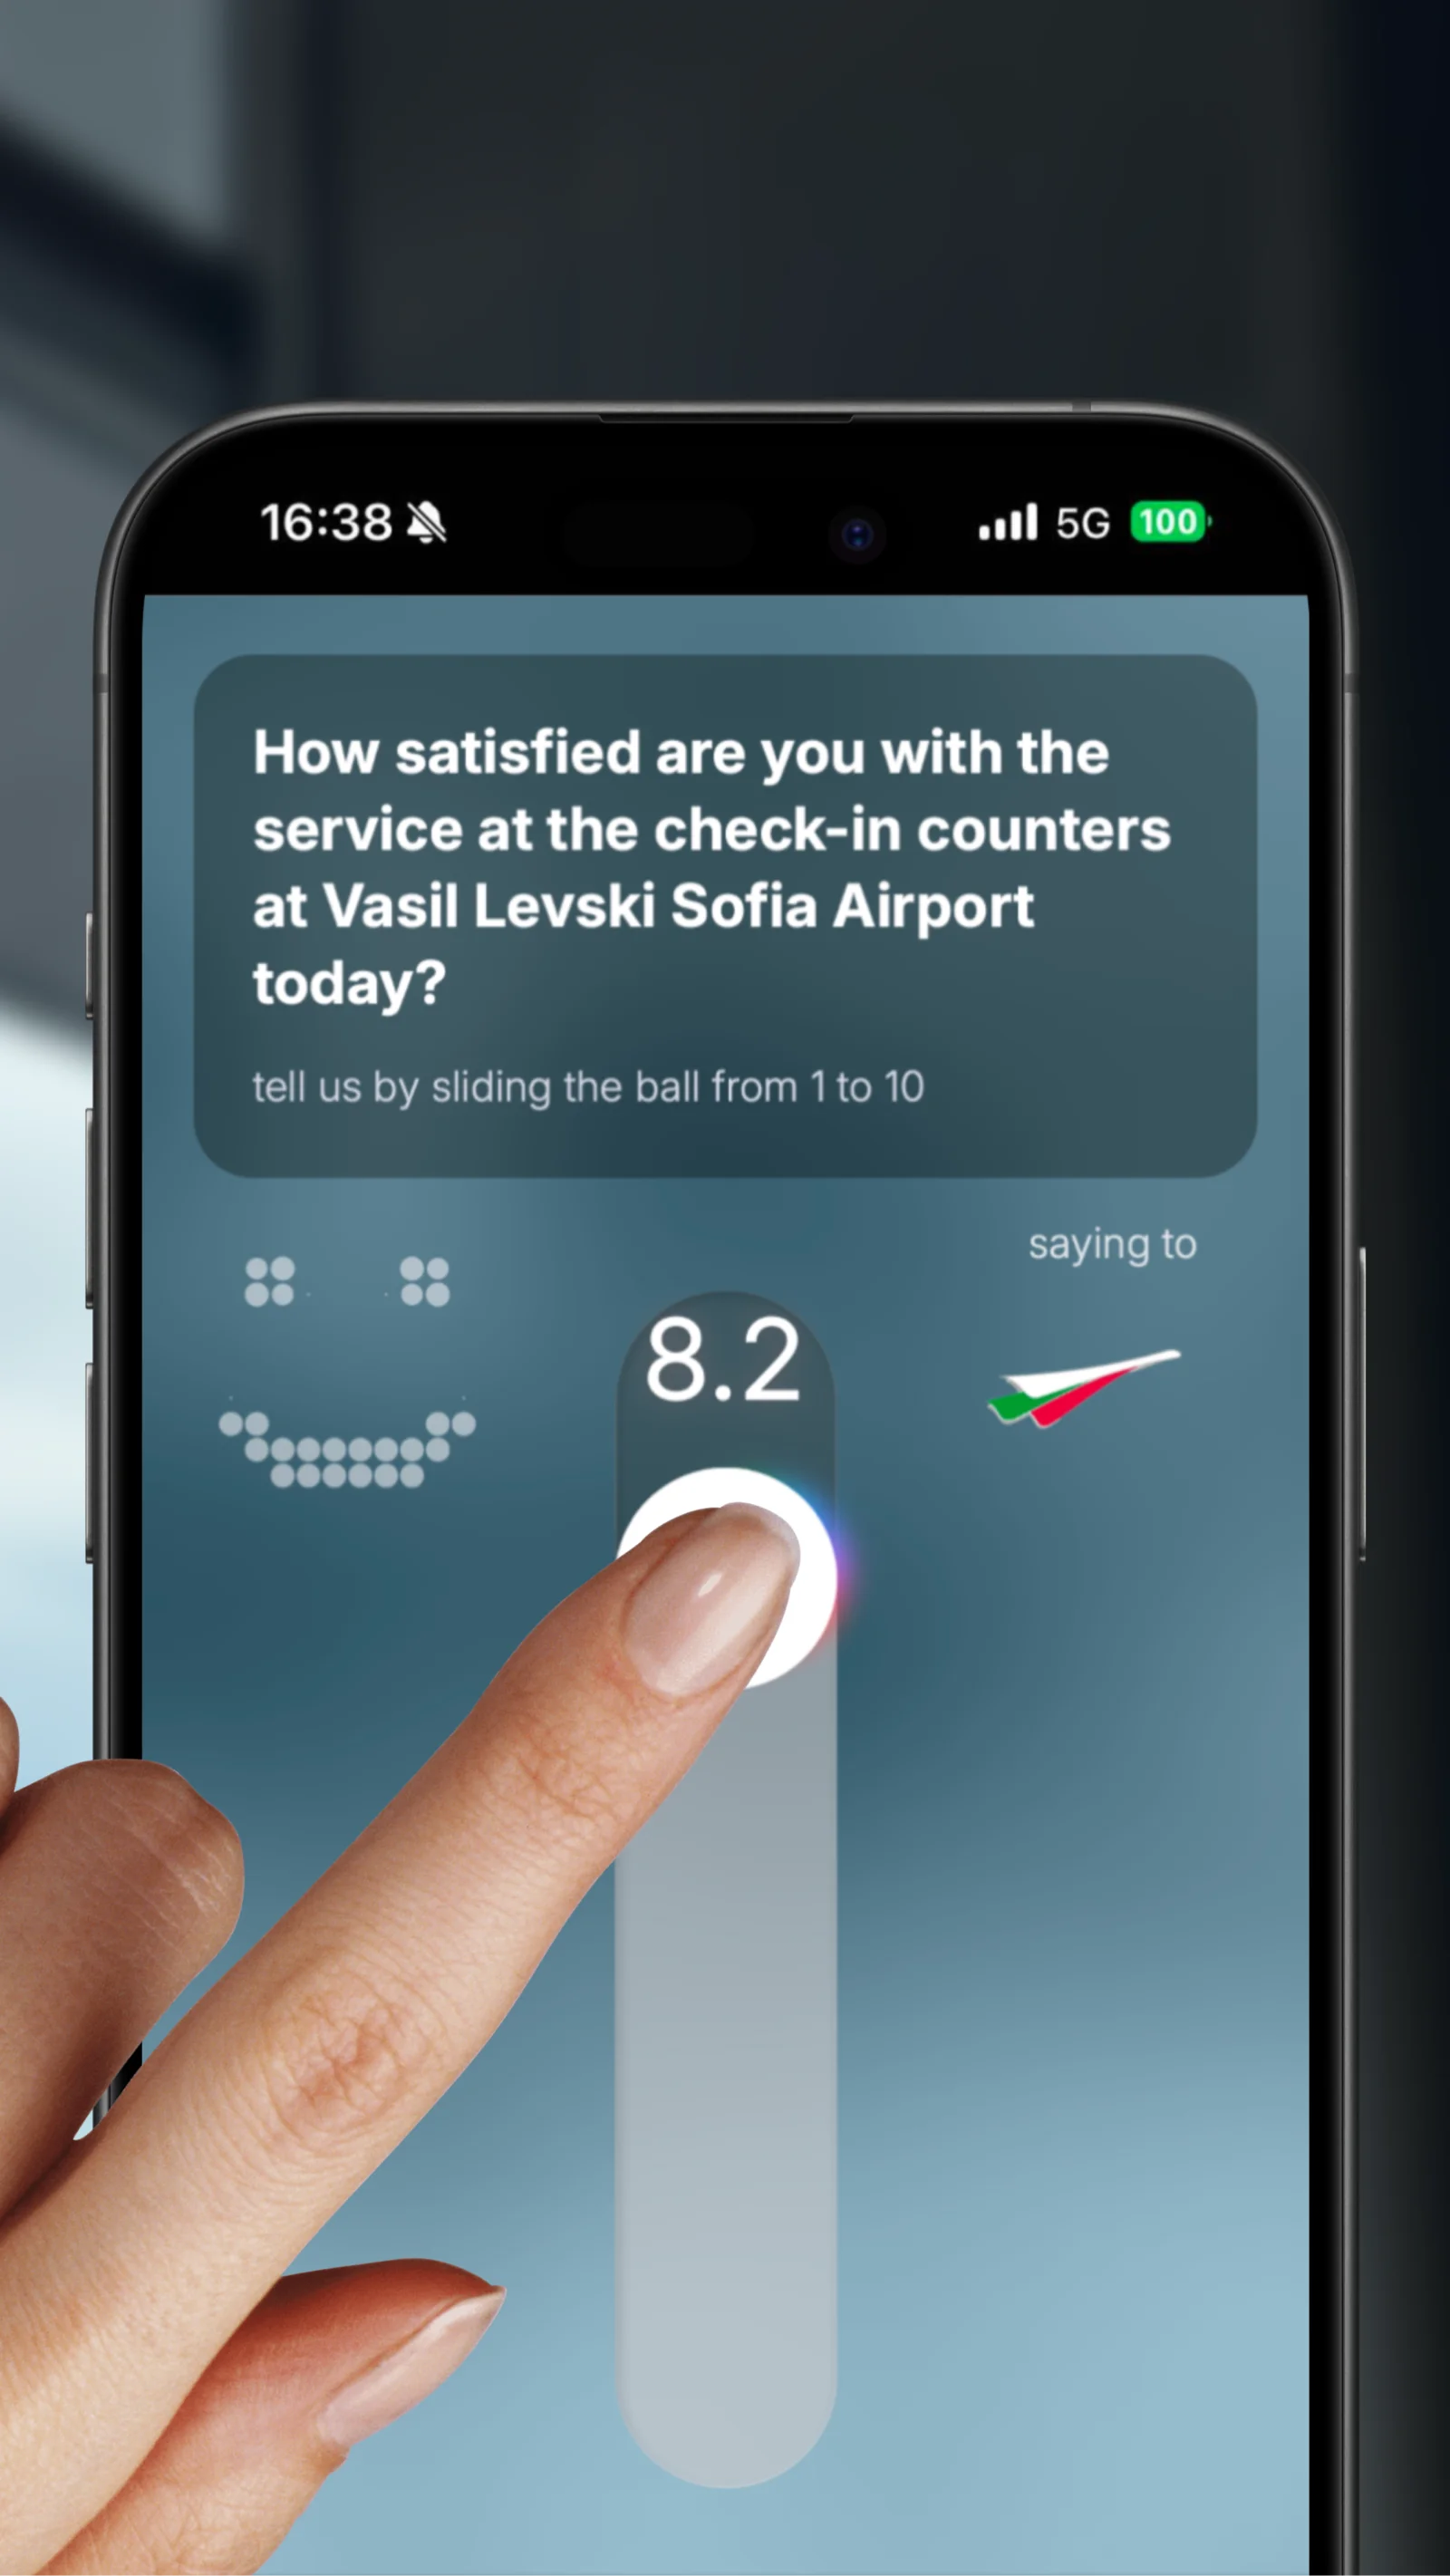
Rates
Anonymously, on a 1-10 scale, in the device's language
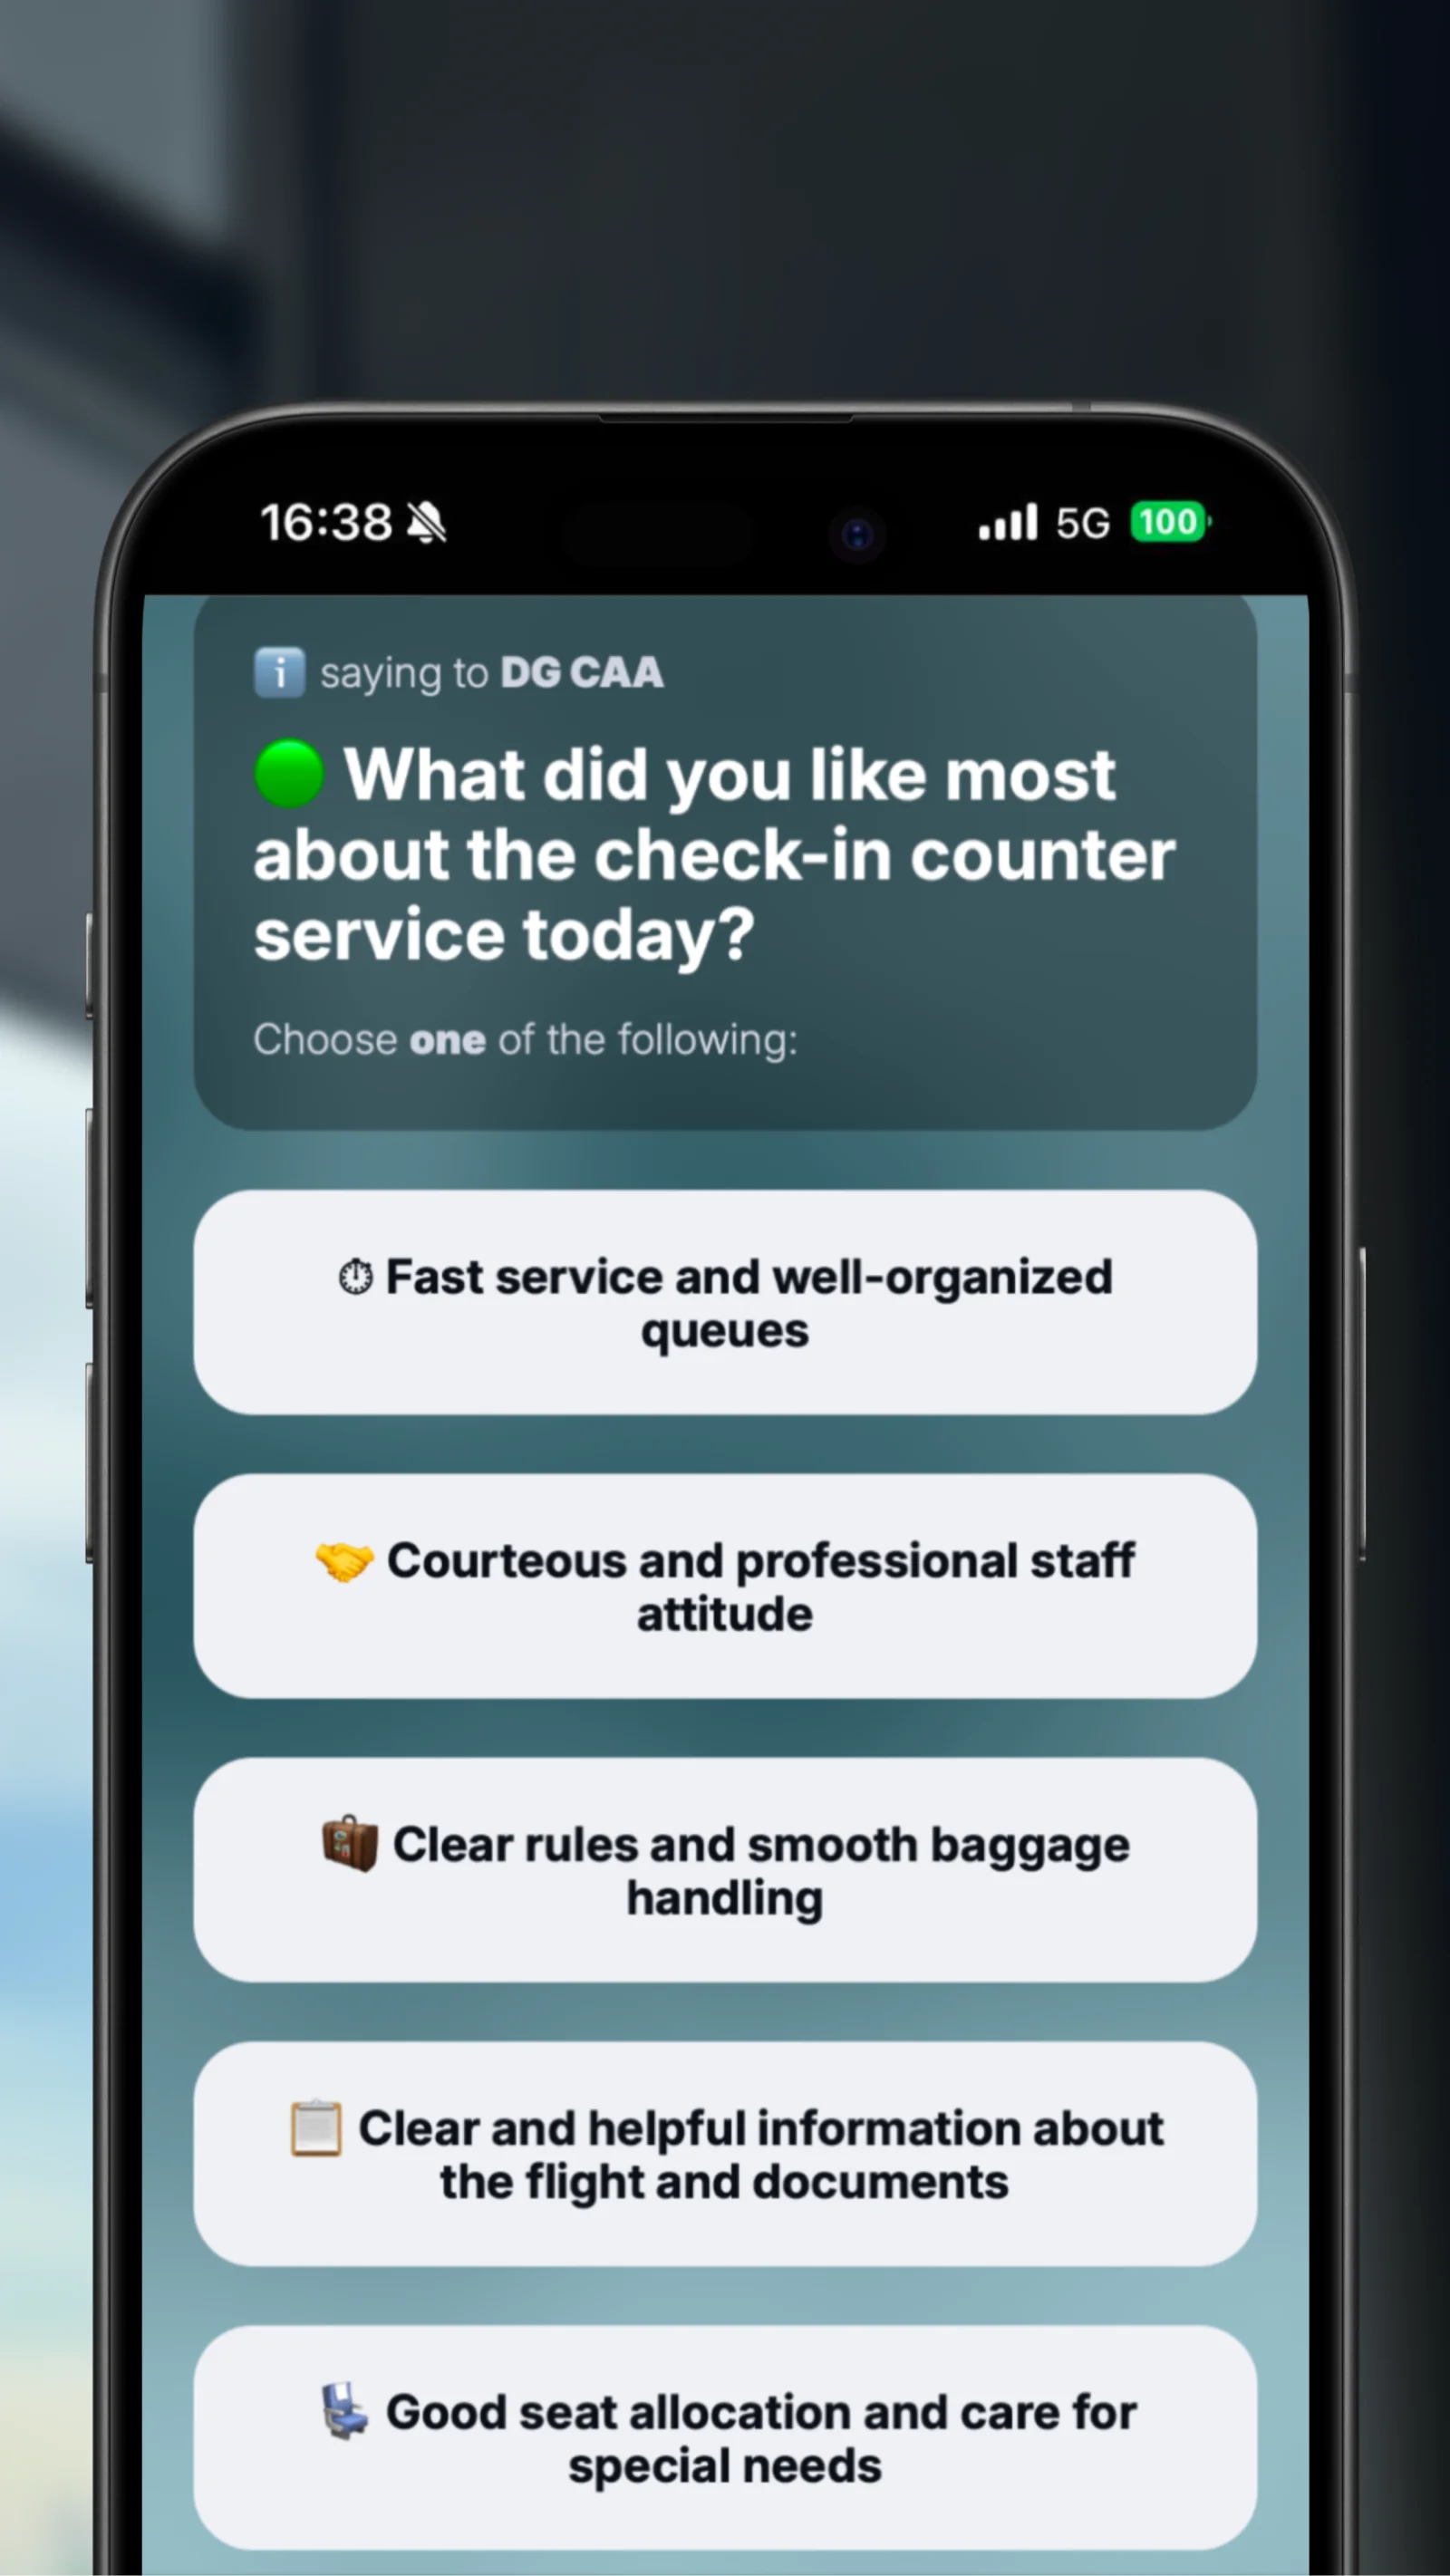
Shares
What they liked and what can be improved in that zone

Receives
A thank you and useful links - to the airport website, baggage info, or a free comment
Try it yourself
This is exactly what the passenger sees. Takes 30 seconds - no app, fully anonymous.
- In seconds

- Anonymous
- No app needed
The Scale
Four airports. One platform.
Sofia Airport
Varna Airport
Burgas Airport
Plovdiv Airport
1000+
opinions/month
500+
QR points
7
languages
What you get
What the platform includes
500+ feedback points
A QR code at every zone of the passenger journey.
7 languages automatically
The survey adapts to the passenger's device language.
Automatic notifications
On a low rating - notification to the responsible manager with location and details.
Management dashboard
NPS by airport, terminal, and zone. Trends, comparative analysis, and automated weekly reports.
ACI ASQ compatibility
Data covers 10 zones of the passenger experience per the ACI Airport Service Quality standard.
Comparative analysis
Comparison across 4 airports, between terminals, and between zones - for the first time with objective data.
ACI Airport Service Quality
We cover 10 zones of the passenger experience
Check-in
Wait time, efficiency, staff courtesy
Security control
Process, courtesy, sense of safety
Business lounges
Comfort, service, amenities
Smoking area
Accessibility, cleanliness, ventilation
Restrooms
Cleanliness, availability, maintenance
Overall experience
General rating from arrival to departure
Gates
Navigation, information, comfort
Waiting areas
Seating, charging, temperature
Baggage area
Wait time, information, trolleys
Airport buses
Frequency, comfort, accessibility
Who it's for
One tool for three management levels
DG CAA leadership
Strategic overview of all four airports. Comparison by zone, terminal, and period. Data for investment priorities.
Operations manager
Automatic notifications on issues. Knows when and where passengers are dissatisfied. Responds in hours, not weeks.
Maintenance and cleaning
Direct passenger feedback for specific zones. Prioritize cleaning and repairs based on real data.
The passenger journey
How passenger feedback reaches management
Arrival
The passenger notices a QR code at the airport
Rating
Scans and rates in seconds, in their own language
Shares
Describes what they liked or what can be improved
Notification
On a low rating, the manager receives a notification with location
Response
The on-site team responds on time
Trend
Reports reveal recurring patterns by zone
Decision
Data informs improvement priorities
Transformation
Response time
Survey languages
Feedback points
Cross-airport comparison
Before kazva.bg
- ✕ Sporadic paper surveys, processed manually
- ✕ Results arrive weeks after travel
- ✕ Bulgarian only - no input from foreign passengers
- ✕ No comparison between airports
With kazva.bg
- ✓ QR code at every zone - 500+ points across 4 airports
- ✓ Real-time data, available instantly
- ✓ 7 languages - every passenger's opinion
- ✓ Comparison SOF vs VAR vs BOJ vs PDV
- ✓ Investment decisions based on data
Gallery
Implementation
Three steps to first results
Mapping
Identifying assessment zones, designing questions in 7 languages, mapping to ACI ASQ categories.
Launch
We provide QR codes and materials. We set up the management dashboard, notifications, reports, and access permissions.
First results
Real-time data from all zones. NPS by airport and terminal, trends, and automatic reports.
Approach comparison
| kazva.bg | Traditional approach | |
|---|---|---|
| Data | Real-time | Weeks to months |
| Coverage | Every passenger, every zone | Small sample |
| Notifications | Automatic, real-time | None |
More case studies
Employee feedback - every day, not once a year
QR code at the workplace. Anonymous rating in 30 seconds. HR sees results immediately.
Finance / HRBORICA - 29 offices, one platform
29 offices, one dashboard. Customer ratings by location and period.
RetailMinimart - 300+ stores, one platform
Every store gets its own rating. Management sees the full picture.
Managing an airport or transport hub?
See how real-time passenger feedback improves operations and ratings.
Book a Meeting